About Nhance in 30 seconds
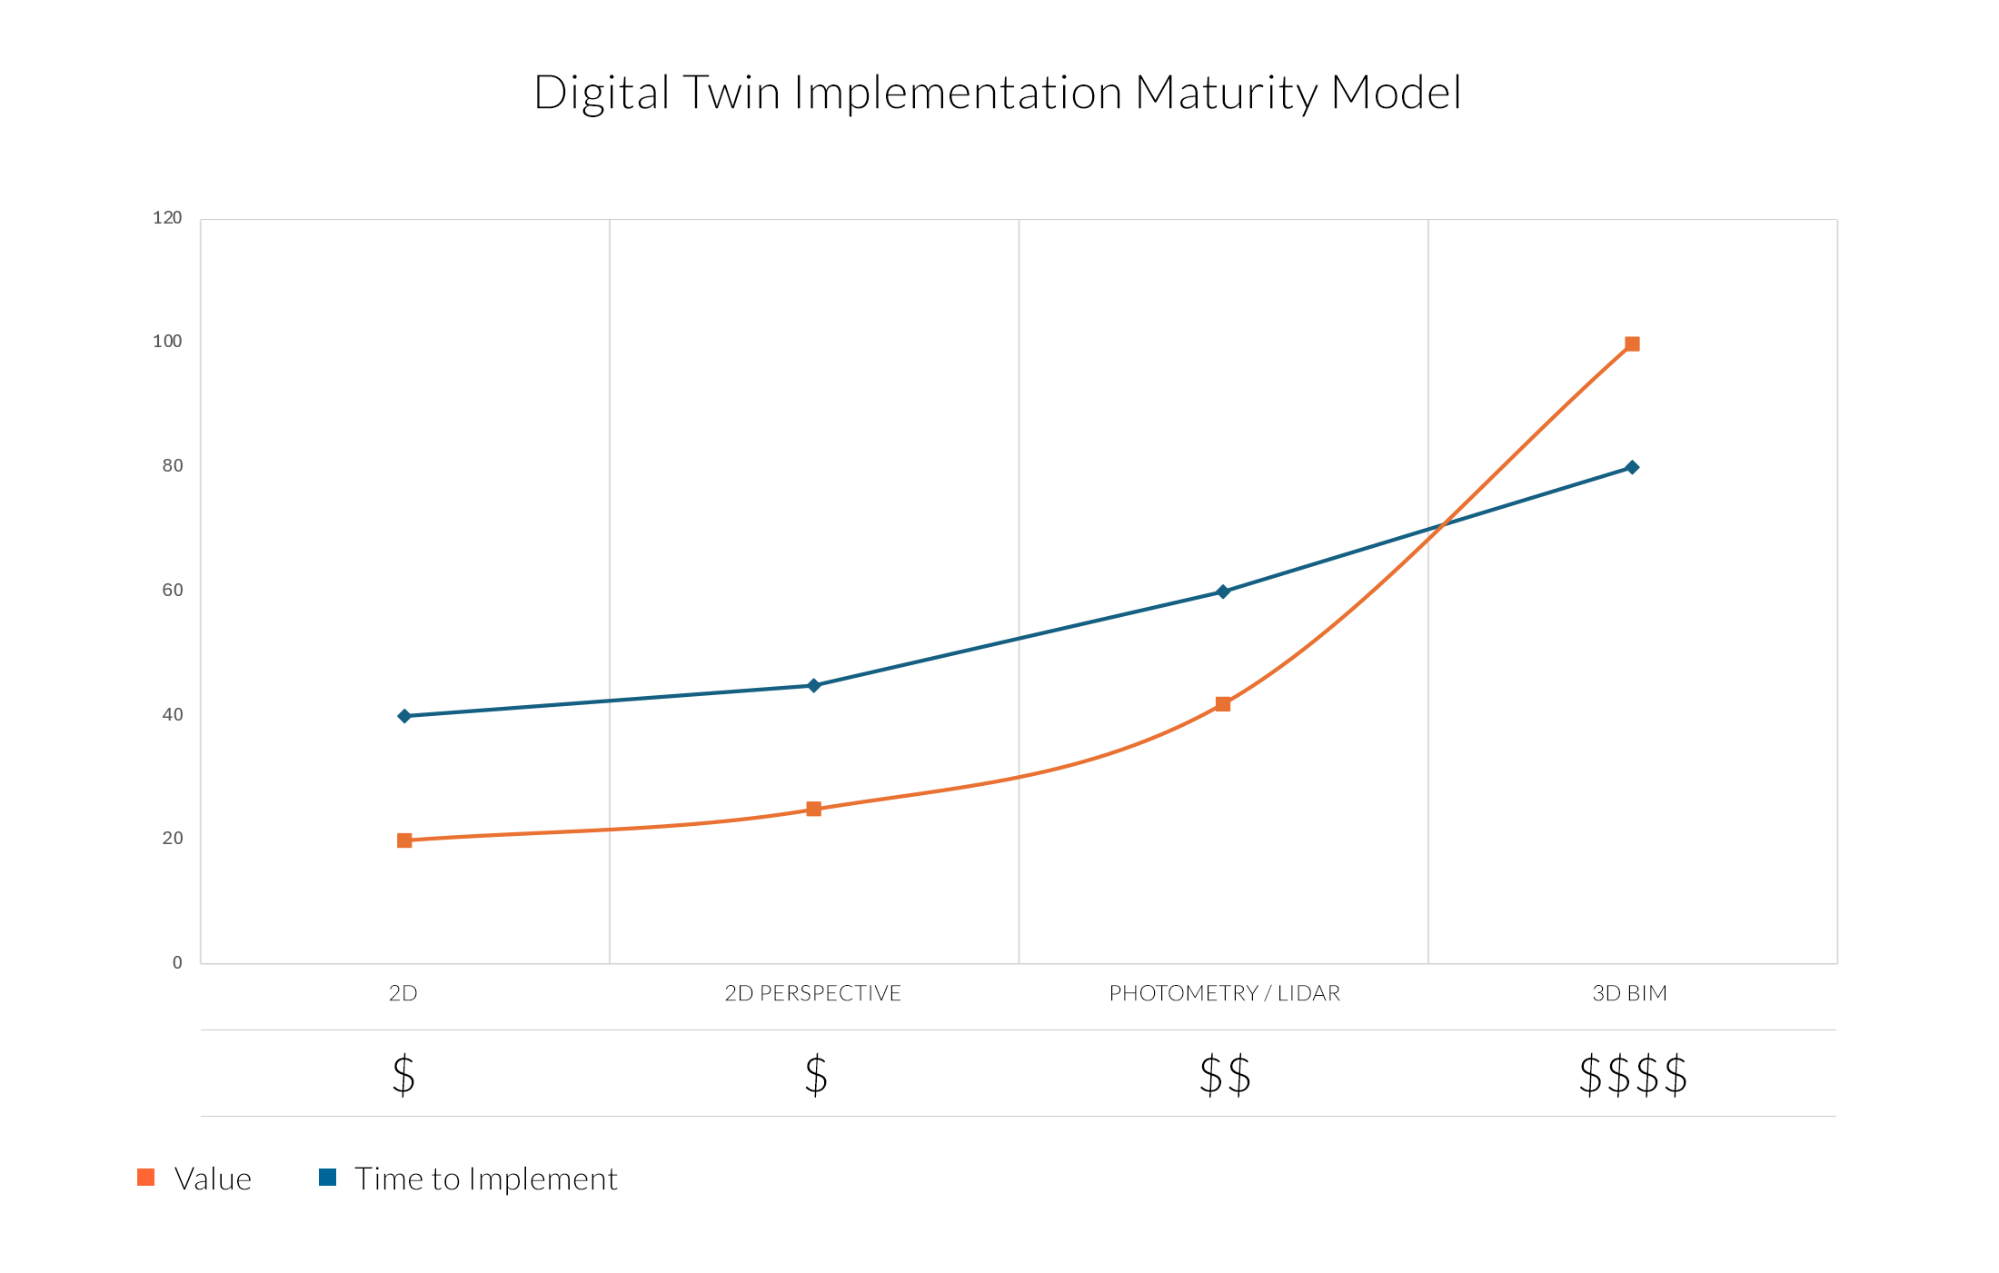
Digital Twin Implementation Maturity Model
Understanding the Trade-Off Between Value, Time, and Cost
As smart buildings and digital transformation take center stage, Digital Twins have emerged as the cornerstone of data-driven infrastructure. But deploying a digital twin isn’t an all-or-nothing decision — it’s a journey that evolves over stages.
The updated chart below captures the relationship between value delivered, time to implement, and relative cost across different stages of maturity — from basic 2D plans to fully integrated 3D BIM models.
Start Where You Are — Scale As You Grow
Digital twin adoption isn’t binary. It’s layered, iterative, and adaptable to your building’s current digital maturity. Here’s how to think about each stage:
Stage 1: 2D — The Quick Win
What It Includes: Floor plans, static PDFs, or CAD drawings used as a baseline to map assets and systems.
Value: Foundational — helps centralise basic building data
Time to Implement: Minimal
Cost: $
Use Case: Great for brownfield buildings, existing portfolios, or rapid deployment for visual mapping.
A fast, low-cost way to digitise and enable QR-based tagging, simple asset tracking, and visual documentation.
Stage 2: 2D Perspective — Contextual & Spatial
What It Includes: Interactive 2D overlays with zoning, layering, occupancy data, and fault visualisation.
Value: Moderate
Time to Implement: Still fast
Cost: $
Use Case: Useful for modern offices or campuses looking for more intuitive interfaces without needing 3D infrastructure.
Makes it easy to manage by space — book rooms, identify faults, and view real-time zone data.
Stage 3: Photometry — Realism Without BIM
What It Includes: 3D photogrammetry or LiDAR-based models created from site scans (ideal for buildings without existing BIM files).
Value: High
Time to Implement: Moderate
Cost: $$
Use Case: Brownfield facilities, legacy buildings, or construction projects without structured digital documentation.
You get a realistic, navigable twin with the ability to tag assets, monitor environments, and visualise activity — without rebuilding CAD models.
Stage 4: 3D BIM — The Gold Standard
What It Includes: A fully integrated BIM model layered with MEP systems, sensors, energy meters, BMS controls, and real-time analytics.
Value: Very High
Time to Implement: Longest
Cost: $$$
Use Case: Ideal for new construction, capital-intensive projects, or long-term owner-occupied properties.
The richest form of digital twin, enabling predictive maintenance, operational simulation, and deep lifecycle analytics — from design through decommissioning.
What the Chart Tells Us
- Value increases with each step — every stage delivers tangible benefits.
- Time to Implement grows steadily, with a steep climb at the final stage.
- Cost starts low and spikes at the 3D BIM phase — justifying deeper ROI evaluation.
The sweet spot for many clients lies in Stage 2 or 3, offering high utility with manageable time and budget constraints. That’s where Nhance can help fast-track your journey.
Final Thought: It’s a Journey, Not a Leap
Digital Twins don’t have to be perfect from day one.
Start where your building is today. Build the foundation. Add intelligence layer by layer. And when you’re ready, unlock the full potential of predictive, data-driven building performance.
Ready to Begin Your Digital Twin Journey?
Talk to a Twin Consultant
Request a Live Demo
Download Our Maturity Framework PDF
Quote
A digital twin isn’t just a replica of your building — it’s your single source of truth. It turns every asset, every sensor, and every square foot into actionable intelligence. For owners and operators, it’s not the future — it’s the new foundation for smarter, more sustainable real estate.